Diversity metrics Shiny app
Teaching
Shiny app for teaching diversity metrics to undergraduate students
This Shiny app is used for teaching diversity metrics to undergraduate students at the University of Queensland.
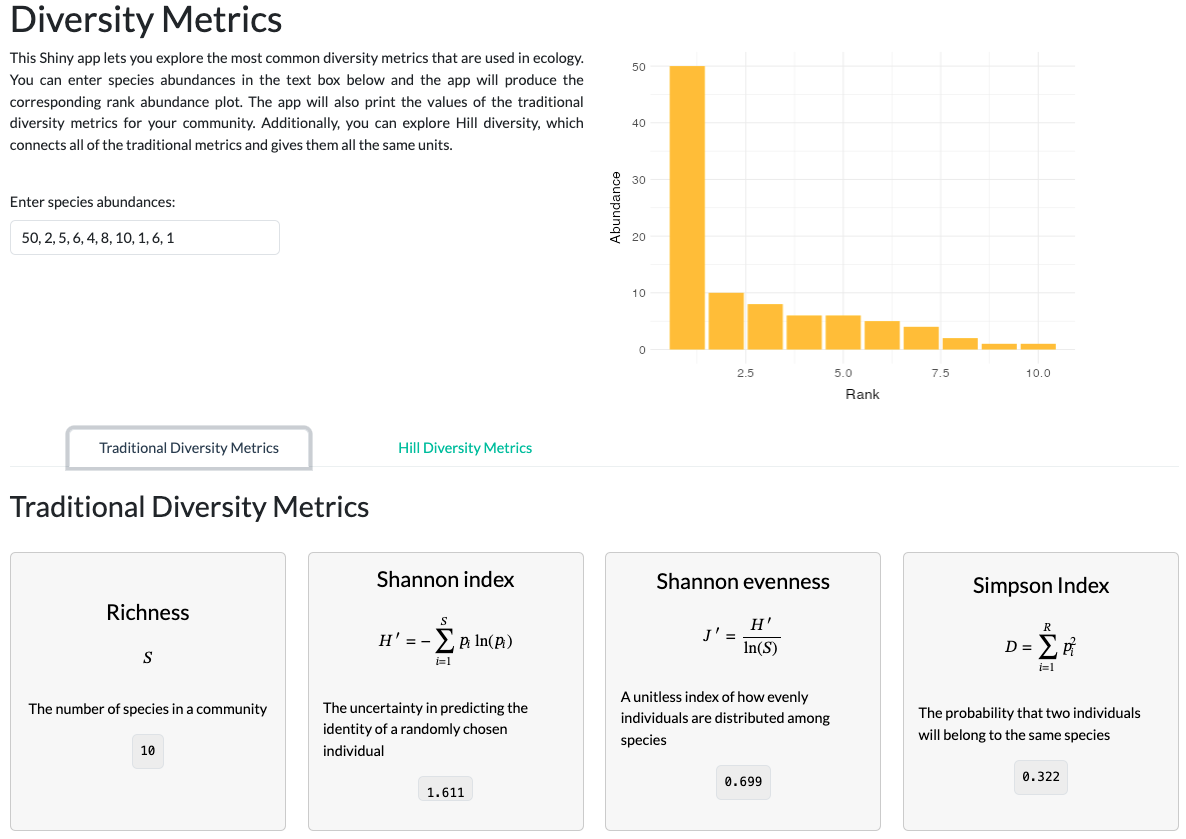
This Shiny app lets you explore the most common diversity metrics that are used in ecology. You can enter species abundances in the text box below and the app will produce the corresponding rank abundance plot. The app will also print the values of the traditional diversity metrics for your community. Additionally, you can explore Hill diversity, which connects all of the traditional metrics and gives them all the same units.